
Should You Buy Stocks Hand Over Fist After the Recent Market Sell-Off? Here's What History Shows.
The Dow Jones Industrial Average slid 6%. The S&P 500 fell 8%. And the Nasdaq Composite Index plunged 13%. The bull market investors have enjoyed since the fourth quarter of 2022 appeared to be in jeopardy.
Now, though, all of these indexes are rebounding. They haven't recovered fully, but things are looking much better than were a few days ago.
Should you buy stocks hand over fist after the recent market sell-off? Here's what history shows.
A relatively common occurrence
S&P 500 declines of 8% or more have occurred relatively frequently in the 21st century. Sometimes the market bounced back quickly; sometimes it didn't.
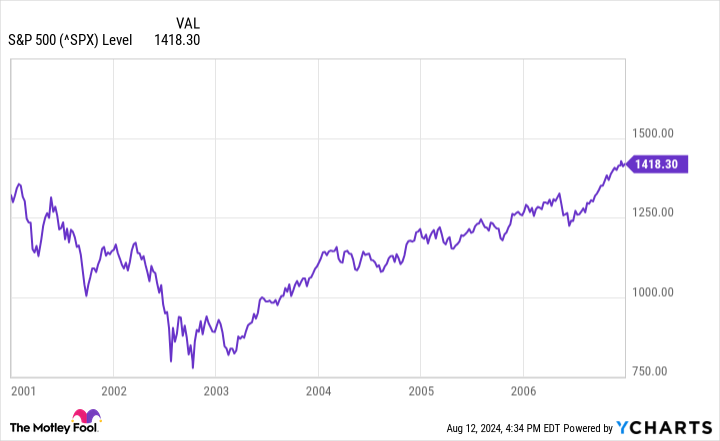
In early 2001, the S&P 500 fell more than 8%. The index attempted to rebound briefly but soon sank again. Investors who bought on the dip back then would have been disappointed. It took nearly five years for the S&P to recover its previous high.
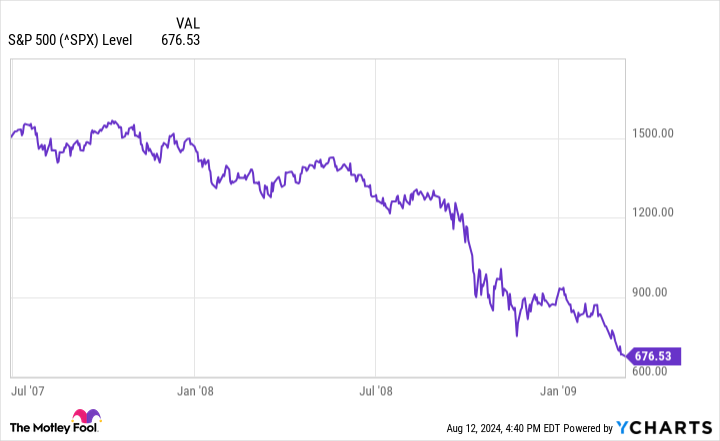
In the third quarter of 2007, the S&P 500 declined more than 8% only to quickly bounce back. Again, though, the comeback was only a temporary one. The market tanked later in the year with the housing market bust. Then came the financial crisis of 2008. The S&P 500 didn't bottom out until the first quarter of 2009.
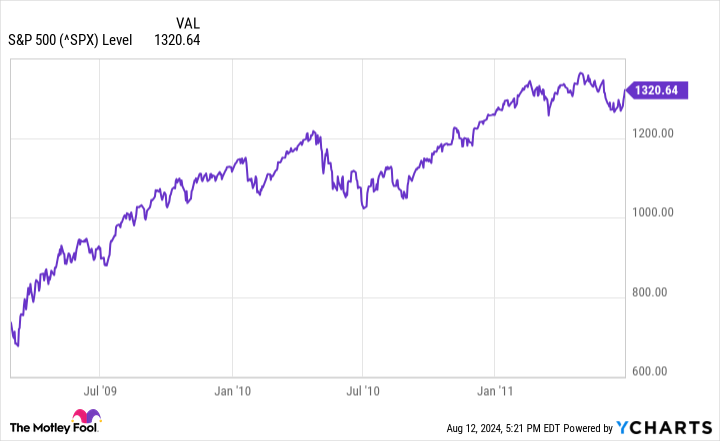
The market recovered strongly throughout the rest of 2009. Although the S&P 500 tumbled more than 8% in early 2010, it soon rebounded. Later in the year, the index fell more than 8% again. This time, the decline lasted several months before the S&P returned to its winning ways.
In mid-2011, the S&P 500 sank more than 8% yet again. It would be well into the next year before the index recovered its previous high.
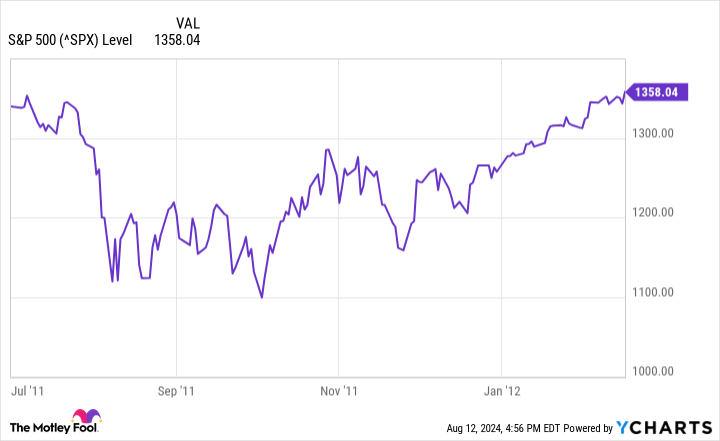
Although the S&P 500 tumbled more than 8% in the second quarter of 2012, it returned to growth relatively quickly. The index then went on to soar for several years.
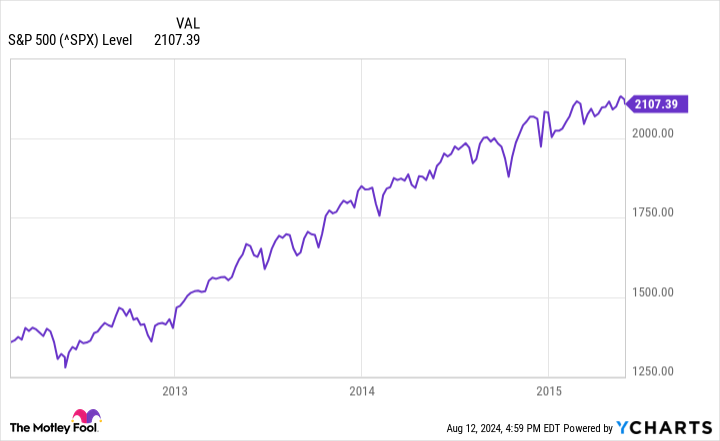
The years of 2015 and 2016 were volatile ones for the market. The S&P 500 sank by a double-digit percentage in Q3 of 2015, recovered, and then plunged even more in early 2016. However, by the end of the summer of 2016, the index was again back on track.
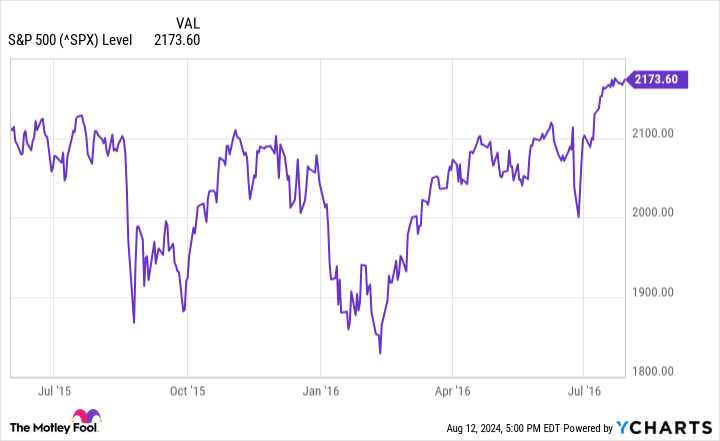
Investors enjoyed blue skies during the rest of 2016 and through 2017. However, 2018 was choppier with the S&P 500 falling by at least 8% twice during the year. But a rebound began near the end of 2018 and continued throughout all of 2019.
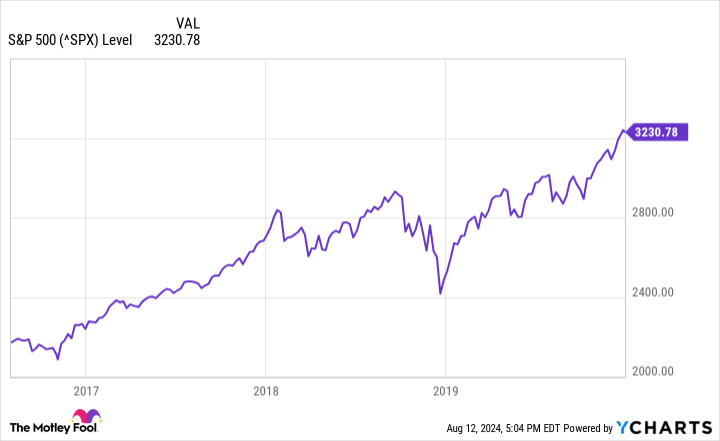
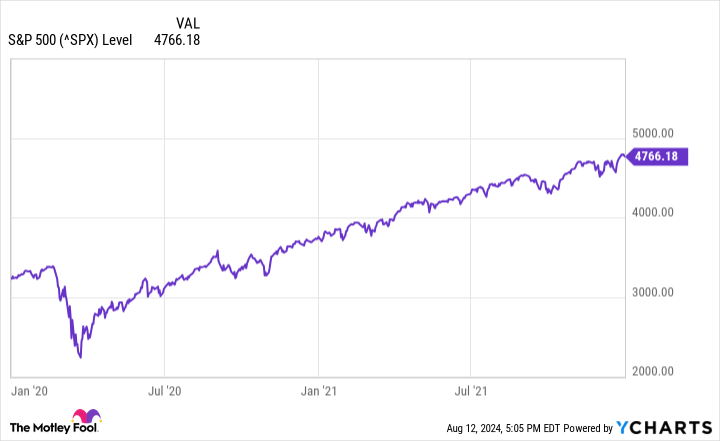
Of course, we all know what happened in early 2020. The S&P 500 plunged on concerns about the COVID-19 pandemic. However, the index roared back within only a few weeks and went on a tear that extended throughout 2021.
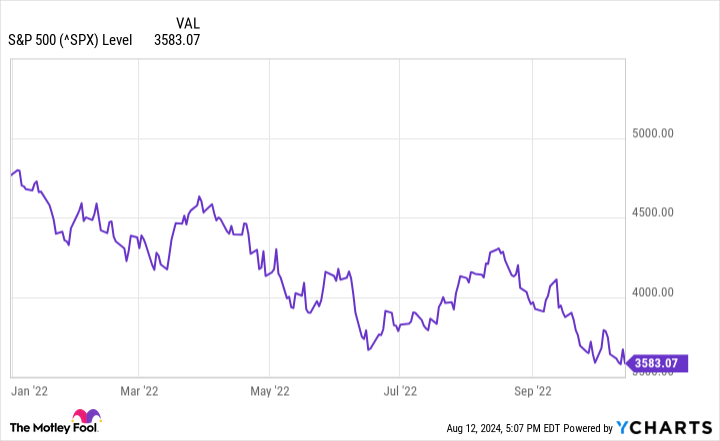
The S&P 500 experienced its worst year in quite a while in 2022. The index fell more than 8% early in the year and then continued to decline for months.
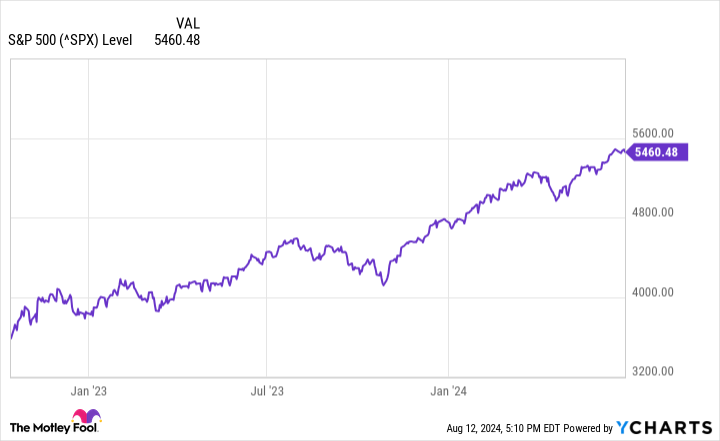
That dismal performance set up the current bull market which began in October 2022. Although the S&P 500 tumbled more than 8% in 2023, it mounted a comeback that lasted until the recent sell-off.
History lesson
You might think that the lesson from history is that there's no way to know how long a given S&P 500 pullback will last. And you'd be right. However, there's a more important lesson for investors. Below is the most important S&P 500 chart to consider:
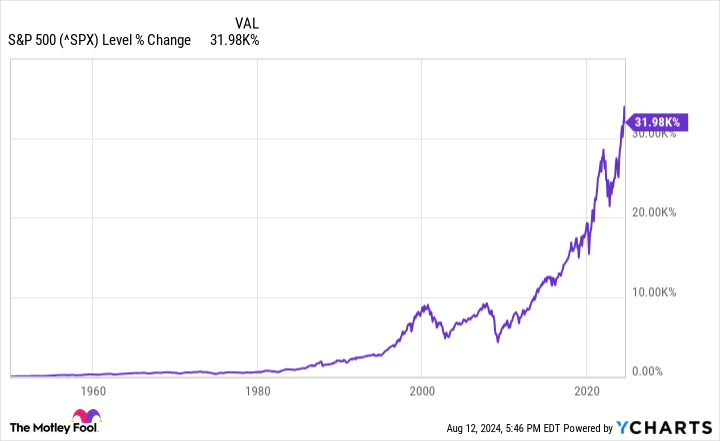
Although the S&P 500 has declined by 8% or more many times in the past, it has bounced back 100% of the time. Investors who simply stayed the course made a lot of money.
So should you buy stocks hand over fist after the recent market sell-off? If you build a diversified portfolio containing the stocks of companies with solid underlying businesses and hold them for the long term, the answer is a resounding "yes."
Don’t miss this second chance at a potentially lucrative opportunity
Ever feel like you missed the boat in buying the most successful stocks? Then you’ll want to hear this.
On rare occasions, our expert team of analysts issues a “Double Down” stock recommendation for companies that they think are about to pop. If you’re worried you’ve already missed your chance to invest, now is the best time to buy before it’s too late. And the numbers speak for themselves:
Amazon: if you invested $1,000 when we doubled down in 2010, you’d have $18,786!*
Apple: if you invested $1,000 when we doubled down in 2008, you’d have $41,151!*
Netflix: if you invested $1,000 when we doubled down in 2004, you’d have $341,447!*
Right now, we’re issuing “Double Down” alerts for three incredible companies, and there may not be another chance like this anytime soon.
*Stock Advisor returns as of August 12, 2024
The Motley Fool has a disclosure policy.
Should You Buy Stocks Hand Over Fist After the Recent Market Sell-Off? Here's What History Shows. was originally published by The Motley Fool